Genes for Translation mapped on a Hilbert Curve
In this post I describe how I mapped a list of genes involved in the Translational process on a Hilbert Curve .
This post was mostly inspired by Gareth Palidwor's recent post titled "Mapping genomes to a Hilbert Curve" see http://www.palidwor.com/blog/?p=123 (and yes, Paulo is right: , a blog can be a source of inspiration)
Wikipedia: A Hilbert curve is a continuous fractal space-filling curve first described by the German mathematician David Hilbert in 1891.

I've played with this idea and written a simple program mapping a list of genes on a Curve.
Finding the genes
First we need to get the name of genes involved in the Translational process. I've used the anonymous mysql GO server at EBI. I'm not a GO guru, so just tell me if the query below was not correct.
The position of those genes was then found using the anonymous mysql server of the UCSC. This mapping information is roughly available in the hg18.refGene table. I've restricted the search to the chromosome chr1.
At the end, my shell looks like this:
mysql -N -hmysql.ebi.ac.uk -ugo_select -pamigo -P4085 go_latest -A -e "SELECT DISTINCT
gene_product.symbol
FROM
term
INNER JOIN graph_path
ON (term.id=graph_path.term1_id)
INNER JOIN association
ON (graph_path.term2_id=association.term_id)
INNER JOIN gene_product
ON (association.gene_product_id=gene_product.id)
INNER JOIN species
ON (gene_product.species_id=species.id)
WHERE
term.name = 'translation' AND
species.ncbi_taxa_id = 9606" |\
gawk 'BEGIN {printf("select distinct name2,txStart,txEnd from refGene where chrom=\"chr1\" and name2 in (\"_\" ");}
{
printf(",\"%s\"",$1);
}
END {
printf(") order by txStart;\n");
}' |\
mysql -h genome-mysql.cse.ucsc.edu -D hg18 -u genome -A
Drawing the map
Then I mapped this list of gene on a Hilbert Curve drawn as SVG. I won't show the code here, it was mostly copied from the code provided on the wikipedia-page. The only major modification was the one used to convert a position on the genome to the curve. For those interested, I put the code here:http://code.google.com/p/lindenb/source/browse/trunk/proj/tinytools/src/org/lindenb/tinytools/HilbertSequence.java
Result
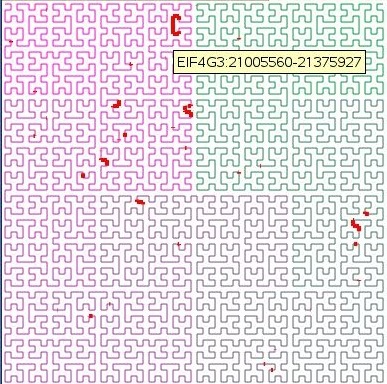
The curve is the human chromosome chr1.
The red lines are the genes.
Moving the mouse over a red line shows a balloon with the name of the gene
That's it.
'

3 comments:
Pierre... interesting material... but I can't stop wondering about the 2D distance between genes is misleading, as the distance on the Hilbert curve map is a non-linear function of the distance on the Hilbert *curve* itself...
There is some hinting about coiledness of DNA... but is the Hilbert curve a good representation of that?
Egon, I agree, this may not be a good representation because it gives a wrong representation of the distances. But it changes from all those linear visualizations of the genome ! :-)
And I guess there is power in the zooming which the curve gives by definition...
Post a Comment